How We Add Value to Public Data With Better Curation And Documentation?
 Photo: Jack Sloop
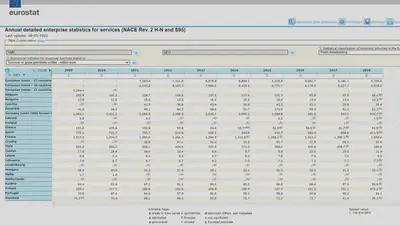
In this example, we show a simple indicator: the Turnover in Radio Broadcasting Enterprises in many European countries. This is an important demand driver in the Music economy pillar of our Digital Music Observatory, and important indicator in our more general Cultural & Creative Sectors and Industries Observatory. Of course, if you work with competition policy or antitrust, than any industry may be interesting to you–but not all of them are well-serverd with data.
This dataset comes from a public datasource, the data warehouse of the European statistical agency, Eurostat. Yet it is not trivial to use: unless you are familiar with national accounts, you will not find this dataset on the Eurostat website.
Our version of this statistical indicator is documented following the FAIR principles: our data assets are findable, accessible, interoperable, and reusable. While the Eurostat data warehouse partly fulfills these important data quality expectations, we can improve them significantly. And we can also improve the dataset, too, as we will show in the next blogpost.
Findable Data
Our data observatories add value by curating the data–we bring this indicator to light with a more descriptive name, and we place it in a domain-specific context with our Digital Music Observatory and Cultural & Creative Sectors and Industries Observatory and a policy-specific context with our Competition Data Observatory and Green Deal Data Observatory. While many people may need this dataset in the creative sectors, or among cultural policy designers, most of them have no training in working with national accounts, which imply decyphering national account data codes in records that measure economic activity at a national level. Our curated data observatories bring together many available data around important domains. Our Digital Music Observatory, for example, aims to form an ecosystem of music data users and producers.
 that help you find our data and match it with other relevant data sources.](/media/img/blogposts_2021/zenodo_metadata_eurostat_radio_broadcasting_turnover_hu2432360a17d3ae8402b8f8c002a73e1d_314223_59bab6a7b48930f62147f1d33751b26b.webp)
We added descriptive metadata that help you find our data and match it with other relevant data sources. For example, we add keywords and standardized metadata identifiers from the Library of Congress Linked Data Services, probably the world’s largest standardized knowledge library description. This ensures that you can find relevant data around the same key term (radio broadcasting) in addition to our turnover data. This allows connecting our dataset unambiguosly with other information sources that use the same concept, but may be listed under different keywords, such as Radio–Broadcasting, or Radio industry and trade, or maybe Hörfunkveranstalter in German, or Emitiranje radijskog programa in Croatian or Actividades de radiodifusão in Portugese.
Accessible Data
Our data is accessible in two forms: in csv tabular format (which can be
read with Excel, OpenOffice, Numbers, SPSS and many similar spreadsheet
or statistical applications) and in JSON for automated importing into
your databases. We can also provide our users with SQLite databases,
which are fully functional, single user relational databases.
Tidy datasets are easy to manipulate, model and visualize, and have a specific structure: each variable is a column, each observation is a row, and each type of observational unit is a table. This makes the data easier to clean, and far more easier to use in a much wider range of applications than the original data we used. In theory, this is a simple objective, yet we find that even governmental statistical agencies–and even scientific publications–often publish untidy data. This poses a significant problem that implies productivity loses: tidying data will require long hours of investment, and if a reproducible workflow is not used, data integrity can also be compromised: chances are that the process of tidying will overwrite, delete, or omit a data or a label.
 are easy to manipulate, model and visualize, and have a specific structure: each variable is a column, each observation is a row, and each type of observational unit is a table.](/img/blogposts_2021/tidy-8.png)
While the original data source, the Eurostat data warehouse is accessible, too, we added value with bringing the data into a tidy format. Tidy data can immediately be imported into a statistical application like SPSS or STATA, or into your own database. It is immediately available for plotting in Excel, OpenOffice or Numbers.
Interoperability
Our data can be easily imported with, or joined with data from other internal or external sources.
](/img/observatory_screenshots/DMO_API_metadata_table.png)
All our indicators come with standardized descriptive metadata, following two important standards, the Dublin Core and DataCite–implementing not only the mandatory, but the recommended descriptions, too. This will make it far easier to connect the data with other data sources, e.g. turnover with the number of radio broadcasting enterprises or radio stations within specific territories.
Our passion for documentation standards and best practices goes much further: our data uses Statistical Data and Metadata eXchange standardized codebooks, unit descriptions and other statistical and administrative metadata.
 related to data interoperability.](/img/reports/european_visbility_publication.png)
Reuse
All our datasets come with standardized information about reusabililty. We add citation, attribution data, and licensing terms. Most of our datasets can be used without commercial restriction after acknowledging the source, but we sometimes work with less permissible data licenses.
In the case presented here, we added further value to encourage re-use. In addition to tidying, we significantly increased the usability of public data by handling missing cases. This is the subject of our next blogpost.
Are you a data user? How could we serve you better?
Shall we do some further automatic data enhancements with our datasets? Document with different metadata? Link more information for business, policy, or academic use? Please get in touch with us!
Daniel Antal
Developer of open-source statistical software
My research interests include reproducible social science, economics and finance.